
The job it does
A simulated execution record connected to the preparation, chart evidence and later review.
EdgeCharts, practise
Crypto charting and simulated execution practice. Charts are included: bring a prepared and inspected idea into a full-size workspace, practise with real market data and simulated orders, then carry the completed record into TradeRank for review.
Current EdgeCharts access and simulated-history limits are shown on the pricing page.
EdgeCharts charting and simulated trading demonstration. The chart uses real market data. Balances, orders, positions and execution shown inside EdgeCharts are simulated, and no customer order is sent to an exchange.
The job it does
A simulated execution record connected to the preparation, chart evidence and later review.
Why it matters
A chart becomes noise when the planned level, invalidation, risk and reason for the decision are separated from execution.
Inside EdgeCharts
EdgeCharts owns chart analysis and simulated execution. It keeps the chosen market, preparation context, indicators, risk controls and resulting evidence together without presenting the activity as live brokerage trading.
Chart
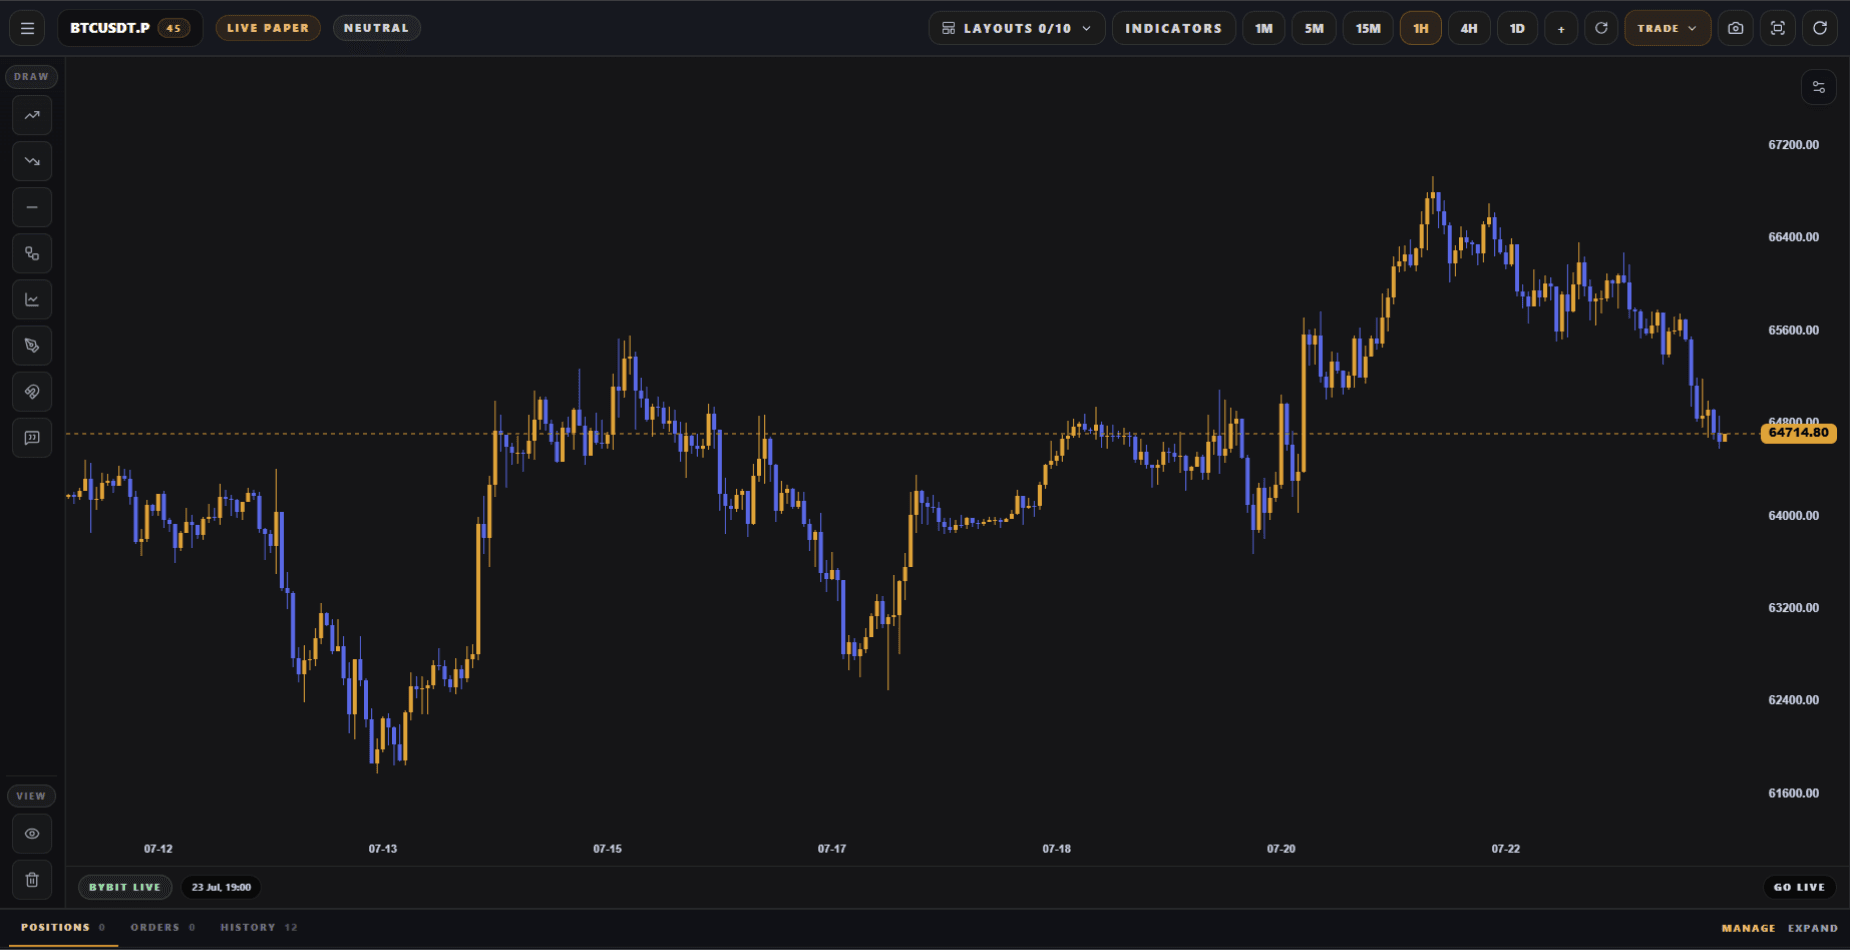
01Open the chosen market in a dedicated chart workspace designed for readable desktop analysis and simulated practice.
Studies
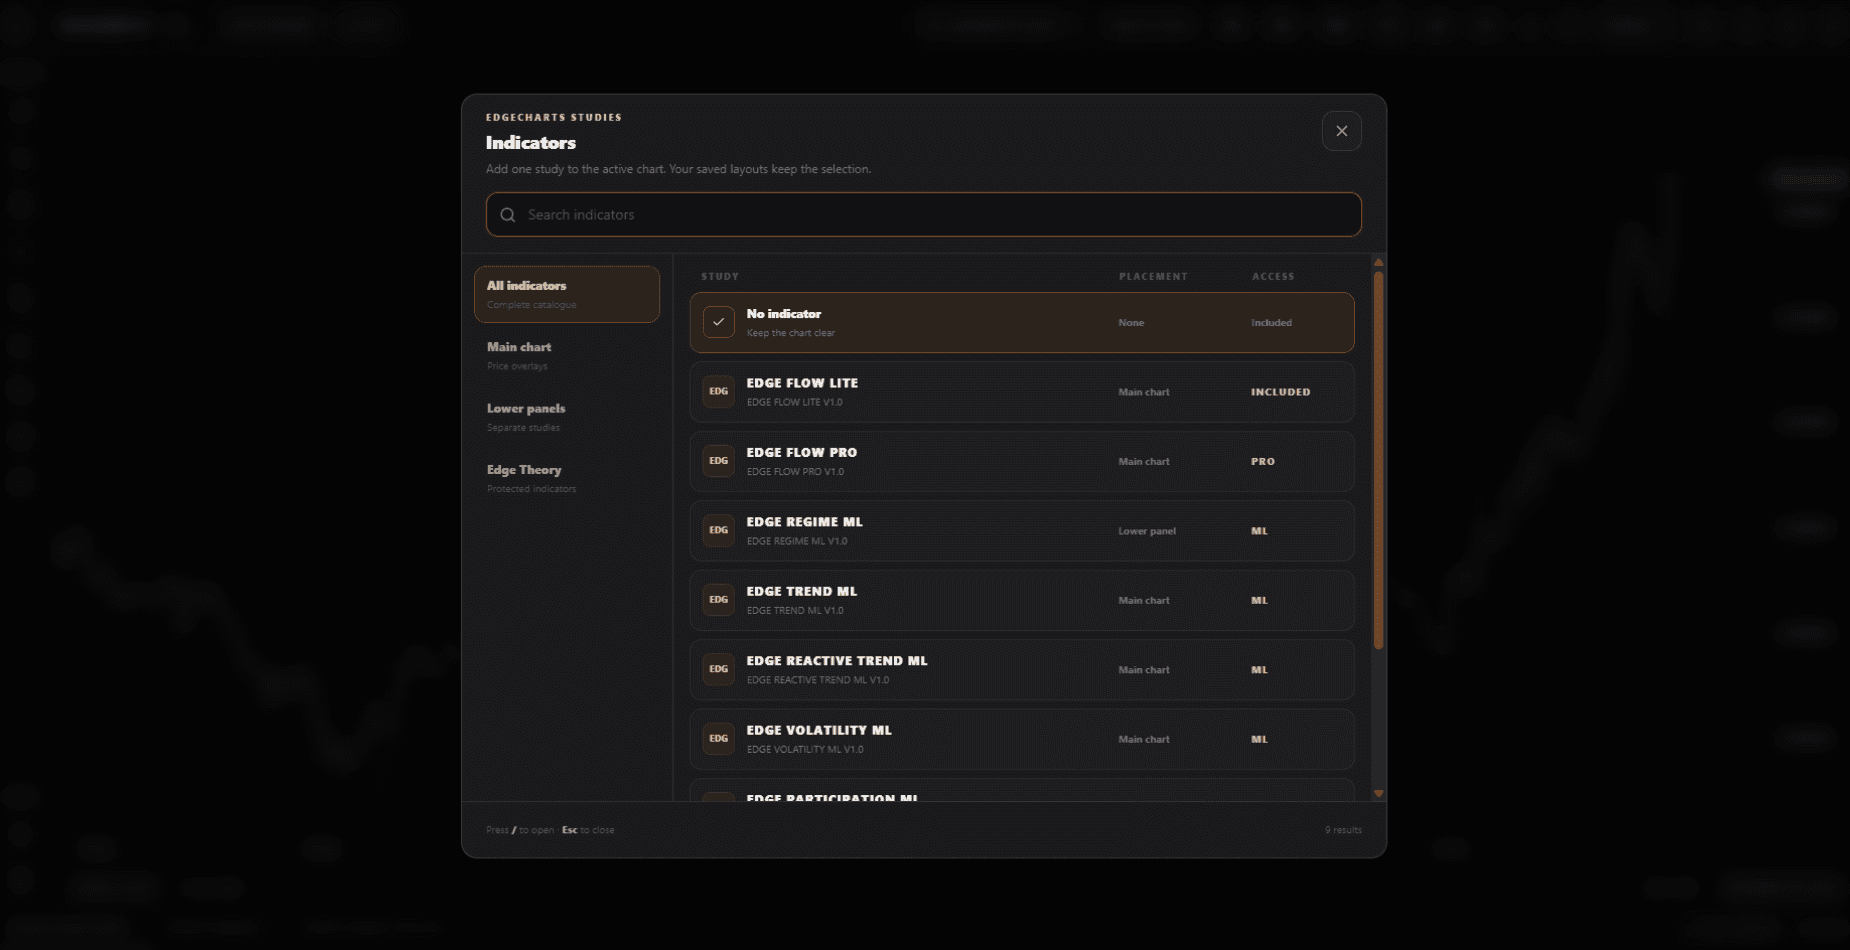
02Add EdgeTheory-owned studies through the chart indicator library and configure the inputs used by the active chart.
Context
03Keep the selected EdgePrep preparation and EdgeDepth confirmation connected to the market being practised.
Practise
04Place and manage simulated orders against real market data without sending a customer order to an exchange.
Risk
05Define stop loss, take profit and position-management decisions before the activity becomes review evidence.
Evidence
06Carry completed simulated activity and chart evidence into the journal so the decision can be recorded and reviewed properly.
Charting with a defined job
Inspect the selected market across multiple timeframes with drawing, layout and chart controls built around focused practice.
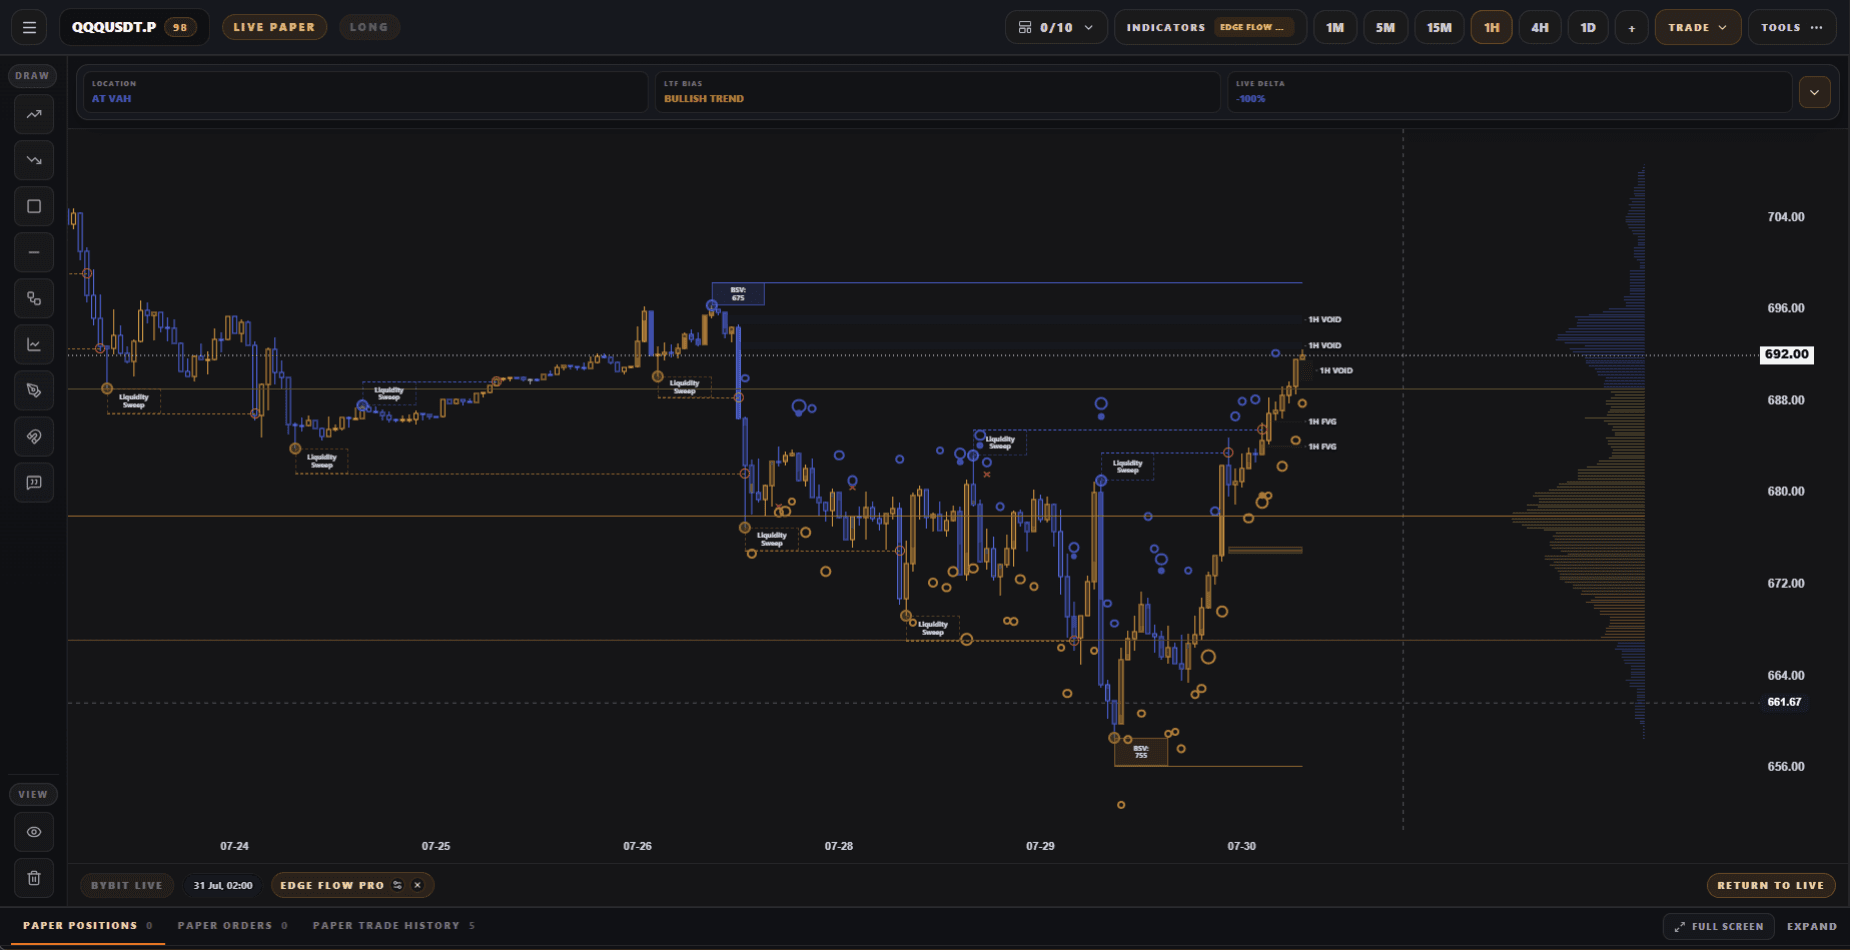
Apply protected Edge Flow tools and adaptive nearest-neighbour studies calculated from the active chart data and configured inputs.
Practise market, limit and stop-limit decisions while balances, orders, positions and execution remain simulated.
Preserve the preparation, order context and chart evidence so the completed decision can continue into TradeRank.
Inside EdgeCharts
Move from the full chart workspace into the EdgeTheory indicator catalogue, then see the protected Edge Flow Pro study applied to the active market.
The eight-stage process
Use the relevant Academy lesson to understand the idea or process being applied.
Choose the market in EdgePrep, document the plan and use EdgeDepth to confirm, wait or stand down.
Examine participation, displayed liquidity and positioning in EdgeDepth without treating one reading as a signal.
Open the prepared market in EdgeCharts and manage the decision with simulated orders and risk controls.
Send the completed activity and chart evidence into TradeRank while the reasoning is still clear.
Compare the execution with the original preparation and complete the required human review fields.
Share the reviewed context in the appropriate Community room and take part in the discussion.
Turn the review and useful feedback into the next lesson, rule or preparation focus.
Connected evidence
Prepared in EdgePrep → inspected in EdgeDepth → practised in EdgeCharts → reviewed in TradeRank.
Published lessons provide the learning context for the process being practised.
The chosen market, planned level, invalidation and preparation record come before chart execution.
Order-flow, participation and liquidity evidence supports a confirm, wait or stand-down decision before simulated practice.
Completed simulated activity becomes a journal record with execution and chart evidence attached.
A reviewed decision can be shared with its reasoning in the appropriate discussion room.
Eligible completed actions can return to the daily loop and the relevant progress journey.
What this does not do
EdgeCharts uses real market data inside a simulated environment. EdgeTheory adaptive studies recalculate from the chart's available data and configured inputs; they do not share private member trades or learn persistently from all users.
Last reviewed 30 July 2026
Evidence standard
The interface demonstration above shows the current product mechanism. Member quotations appear only after membership, consent and moderation checks; absent evidence is not replaced with a broad outcome claim.
Current access: Current EdgeCharts access and simulated-history limits are shown on the pricing page.
Part of the connected workflow
This page stays focused on the product mechanism, access and limitations. The complete Learn to Improve sequence is explained once on How It Works.
EdgeCharts is a charting and simulated-practice environment. It does not provide financial advice, trading signals, live brokerage execution or guaranteed outcomes.