
Edge Theory EdgeCharts
Don't just read the setup.
See it in the market.
Take Edge Theory intelligence and Signals into the chart. Explore market movement, change timeframe, use the available indicators and drawing tools, and practise your process through simulated trading inside the wider Edge Theory workflow.
Investigate first. Practise before committing.
Paper trading is simulated. Simulated balances, orders, positions and results are not live exchange execution.
EdgeCharts / chart canvas
Market context, tools and practice in one workspace.
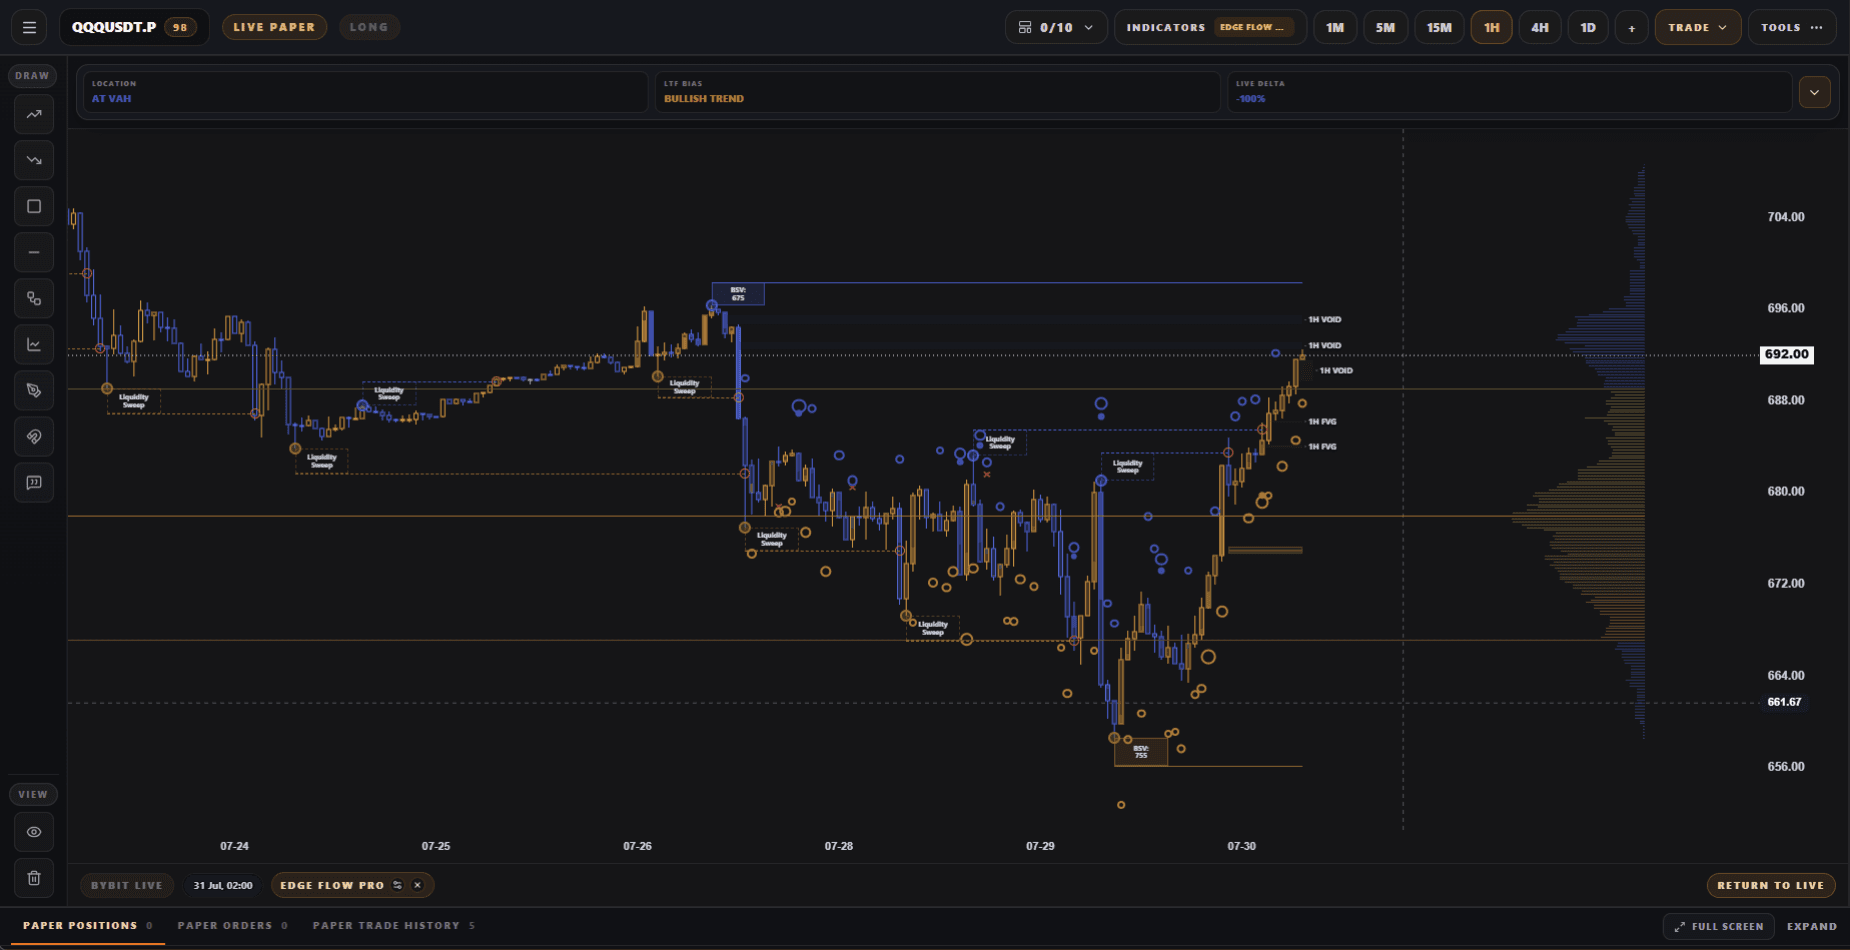
The chart is the canvas
A workspace that changes as your investigation gets deeper.
EdgeCharts connects market movement, timeframe, Signal context and practical tools in one place. The purpose is not to add another screen to watch. It is to give you somewhere useful to look when something deserves your attention.
Market
See the movement
Timeframe
Change the scale
Signal
Place the structure
Studies
Add context
Drawings
Mark your view
Practise
Use simulation
Market context
Start with what price is actually doing.
Market intelligence becomes easier to understand when you can place it back onto the chart. EdgeCharts gives you a visual workspace for examining movement and understanding where an Opportunity or Signal sits within the wider market.
The point is not to add another screen full of information. It is to make the information you have already found easier to investigate.
Market.
Price structure.
Time.
Market data
Start with the market.
Signal context
Bring the setup with you.
Your view
Add context you understand.
Practice
Practise the process.
Timeframe
The same market can look different at a different scale. EdgeCharts keeps timeframe visible as part of the investigation.
Timeframe
The same market can tell a different story at a different scale.
Timeframe is part of understanding a setup. EdgeCharts lets members move through the available timeframes so they can investigate the market in the context relevant to their research or Signal.
The chart remains the centre of the work. The control simply changes the scale at which you are looking.
Signal → chart
Turn Signal levels into something you can actually see.
An Edge Theory Signal gives the setup structure. EdgeCharts gives that structure market context. Take the relevant entry, stop, target and invalidation and understand where those levels sit against the market being investigated.
The Signal stops being a list of fields. It becomes something you can examine visually.
Signal context
Read firstThe relevant Signal supplies the exact context. This preview shows the structure, not a fabricated live setup.
Go deeper
Add the context you use to investigate.
EdgeCharts includes charting tools for members who want to examine market behaviour in more detail. Use the available indicators and studies to add another layer to the chart and explore the setup from your own perspective.
The aim is investigation, not a catalogue of features.
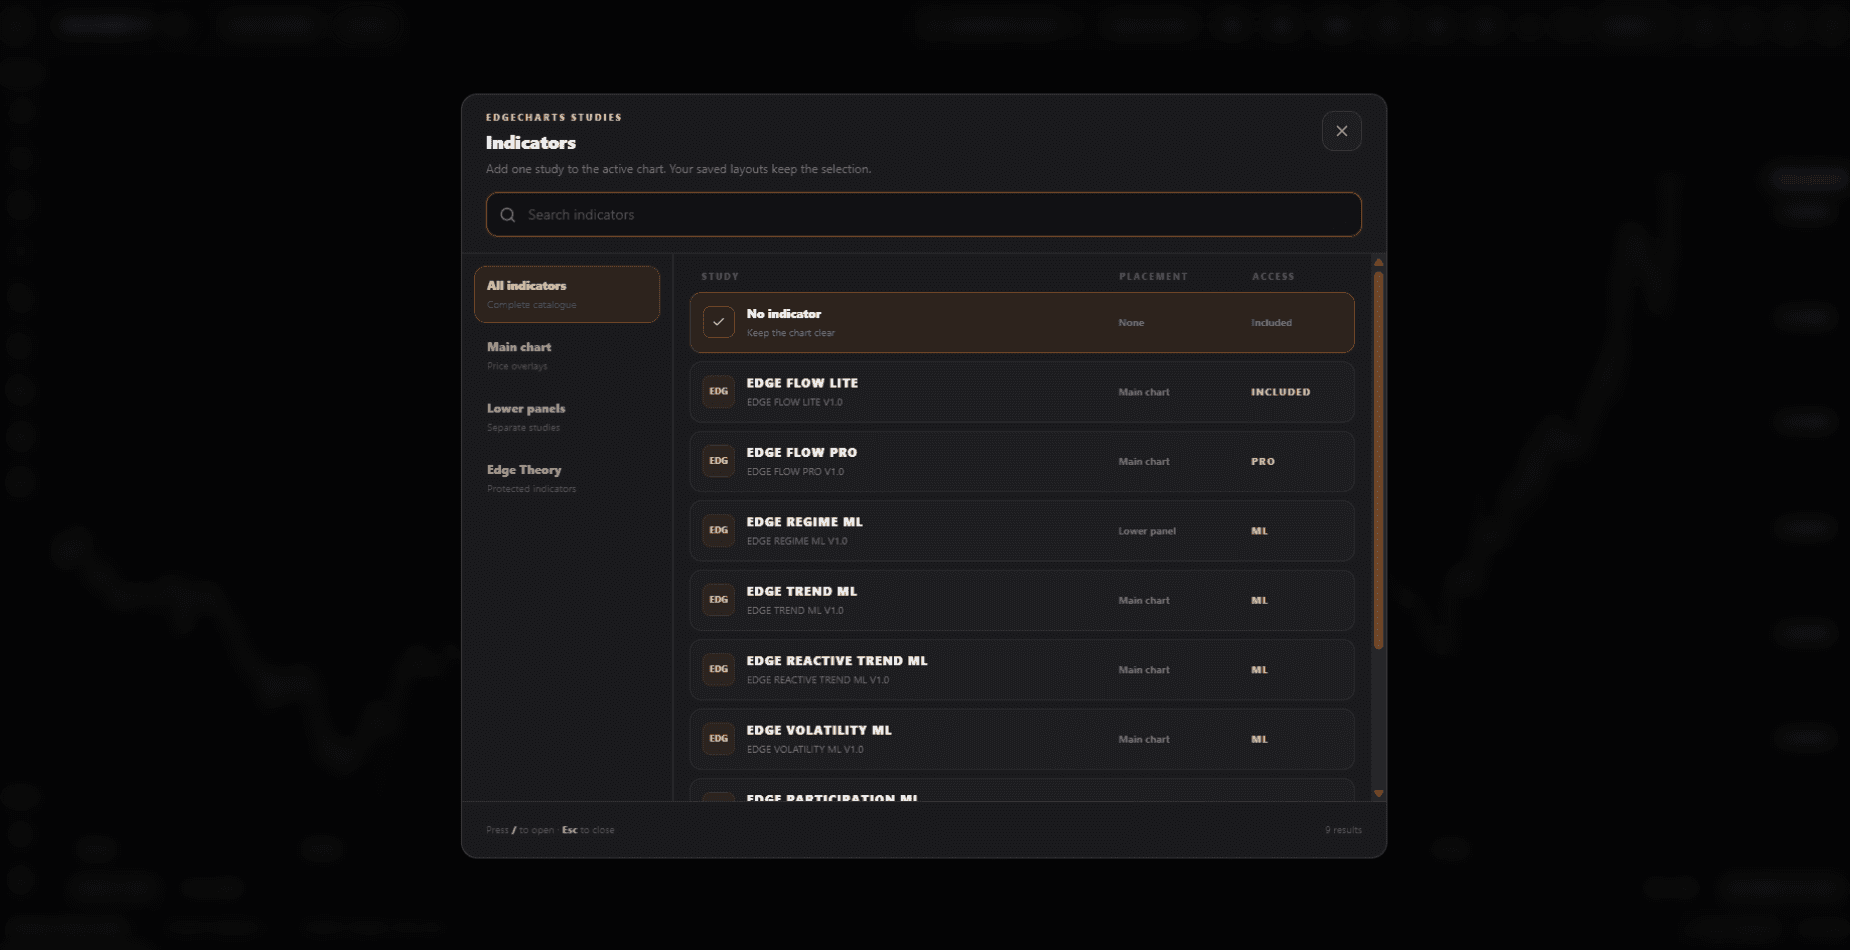
Your analysis
Your analysis
Sometimes the useful mark is the one you make yourself.
Use EdgeCharts' available drawing tools to mark the market and add your own visual analysis. The chart is not simply something to look at. It is a workspace for investigation.
Keep the tools you use close to the market context they help you understand.
Practise the process
See what your decision would look like without confusing practice with live trading.
Edge Theory's paper-trading environment lets members practise using simulated balances, orders and positions. Investigate the market, form a view, practise the action and review what happened.
All without treating simulated activity as exchange execution.
Paper / simulated
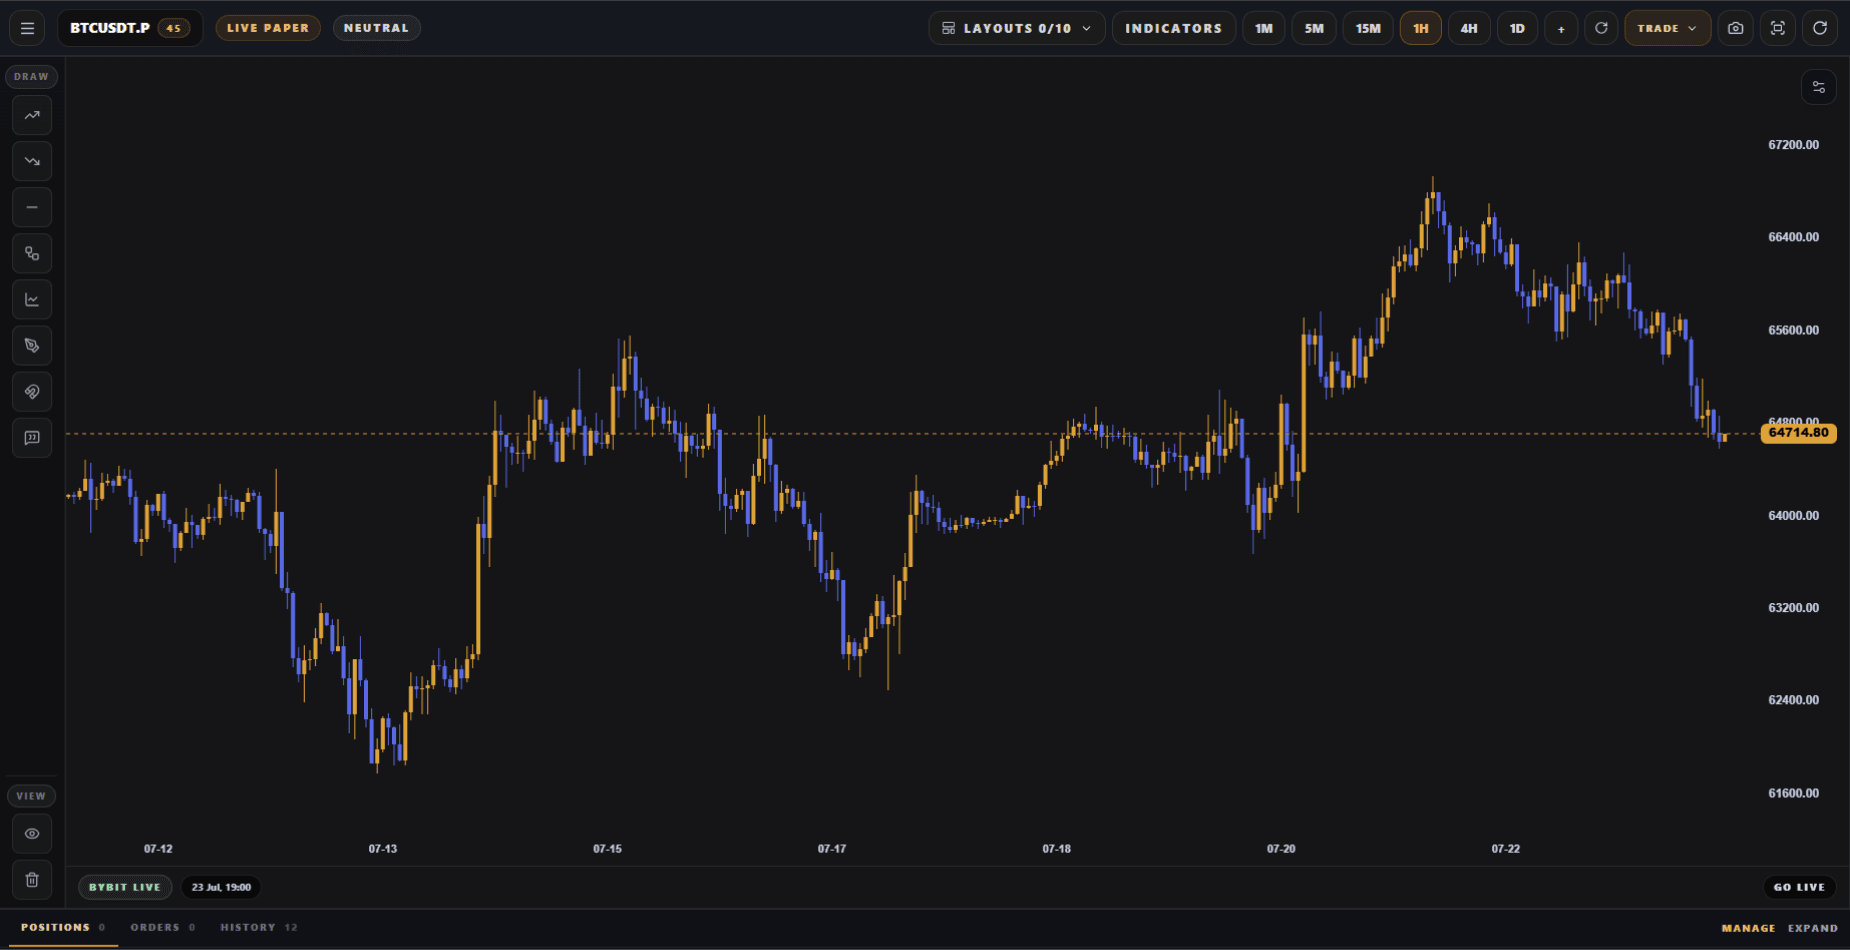
From analysis to practice
Move from looking at the setup to practising the process.
EdgeCharts connects investigation with Edge Theory's simulated trading workflow. Use the chart as the context for simulated orders, positions, position management, closures and the relevant trading history available in the product.
Investigate
Paper / simulated
Simulated order
Paper / simulated
Simulated position
Paper / simulated
Manage
Paper / simulated
Close
Paper / simulated
Review
Paper / simulated
Learn the process. Review the process. Improve the process.
Simulation, clearly labelled
Practice is useful because it isn't the same as live execution.
Paper balances are simulated. Paper orders are simulated. Paper positions are simulated. Paper results are simulated.
That distinction stays visible throughout EdgeCharts so members can learn how a workflow behaves without confusing practice with exchange-connected trading.
PAPER
SIMULATED
Learn the process. Review the process. Improve the process.
From Opportunity to investigation
Pulse helps you find where to look. EdgeCharts lets you look closer.
Pulse helps organise a large crypto market into Opportunities and research worth investigating. When something deserves a closer look, EdgeCharts gives you the workspace to explore the market itself.
A focused hand-off from intelligence to visible market context.
From structure to context
Signals give you the setup. EdgeCharts shows you where it sits.
A published Signal gives research a consistent structure. EdgeCharts lets you examine that structure against the market.
Together they connect what the setup says with what the market looks like. Bots remain optional; EdgeCharts is useful for manual investigation and simulated practice whether or not you automate.
Pulse
Find where to look
Signal
Structure the setup
EdgeCharts
The chart is the canvas.
Practice
Simulate the process
Your Bot
Optional next step
Connected market workflow
Keep charts, practice and exchange-connected workflows clearly defined.
EdgeCharts uses exchange market data where available as part of the charting experience. Edge Theory also has Exchange Connections as part of the wider platform.
Do not confuse market data with trade execution, or paper trading with exchange-connected trading. The relevant mode should remain visible in the workflow.
Market data
Information used to display the chart context available to EdgeCharts.
Paper / simulated
Simulated balances, orders, positions and results. Not live exchange execution.
Exchange-connected
Existing Edge Theory Exchange Connections form part of supported exchange-connected workflows.
Learn on the market itself
Charts make more sense when you can explore them.
If you are still learning, EdgeCharts gives you somewhere to connect the terminology to what is happening on screen.
See what a timeframe changes. Understand where Signal levels sit. Explore the available tools. Make your own annotations. Practise through simulation. You do not need to master everything at once.
Start with the market
See the chart.
Add context.
Investigate the setup.
Practise before complexity.
Your investigation workspace
Move from Pulse or a Signal into the market.
Apply the tools you use.
Investigate the setup.
Practise where useful.
Continue into the workflow that fits you.
For experienced users
Keep research and market context closer together.
For experienced members, EdgeCharts provides the charting workspace inside the wider Edge Theory intelligence platform. The value is not simply having another chart. It is having the chart connected to the rest of the process.
The complete EdgeCharts workflow
One chart. More of the context around it.
EdgeCharts anchors a practical investigation loop without becoming another Products overview.
Pulse
Find where to look
Signal
Structure the setup
EdgeCharts
The chart is the canvas.
Practice
Simulate the process
Your Bot
Optional next step
Look closer when it matters
You don't need more charts. You need a better reason to open one.
Pulse helps narrow where to look. Signals structure selected setups. EdgeCharts gives you somewhere to investigate when something actually deserves your attention. And Bots can take more of the ongoing watching when you are ready to automate.
Pulse finds it.
Signals structure it.
EdgeCharts lets you investigate it.
Bots can keep watching it.
Clear by design
Know which environment you are using.
Charts display the market information available to EdgeCharts. Signals provide structured research. Paper trading provides simulated balances, orders, positions and results. Exchange Connections belong to the wider platform. Bot automation is separate from manually investigating a chart.
Charts, Signals, simulated trading and automation do not guarantee profitable outcomes.
Market data
Chart information available to the workspace.
Signals
Structured market research, not a guarantee.
Paper trading
Simulated activity, not live exchange execution.
Bot automation
A member-configured workflow, separate from the chart.
Edge Theory EdgeCharts
See what the market is
actually showing you.
Take Opportunities and Signals into EdgeCharts, investigate the market in context and practise your process through simulated trading before deciding what comes next.
From intelligence to investigation.
Paper trading is simulated. EdgeCharts does not guarantee a profitable outcome or present simulated activity as live exchange execution.