

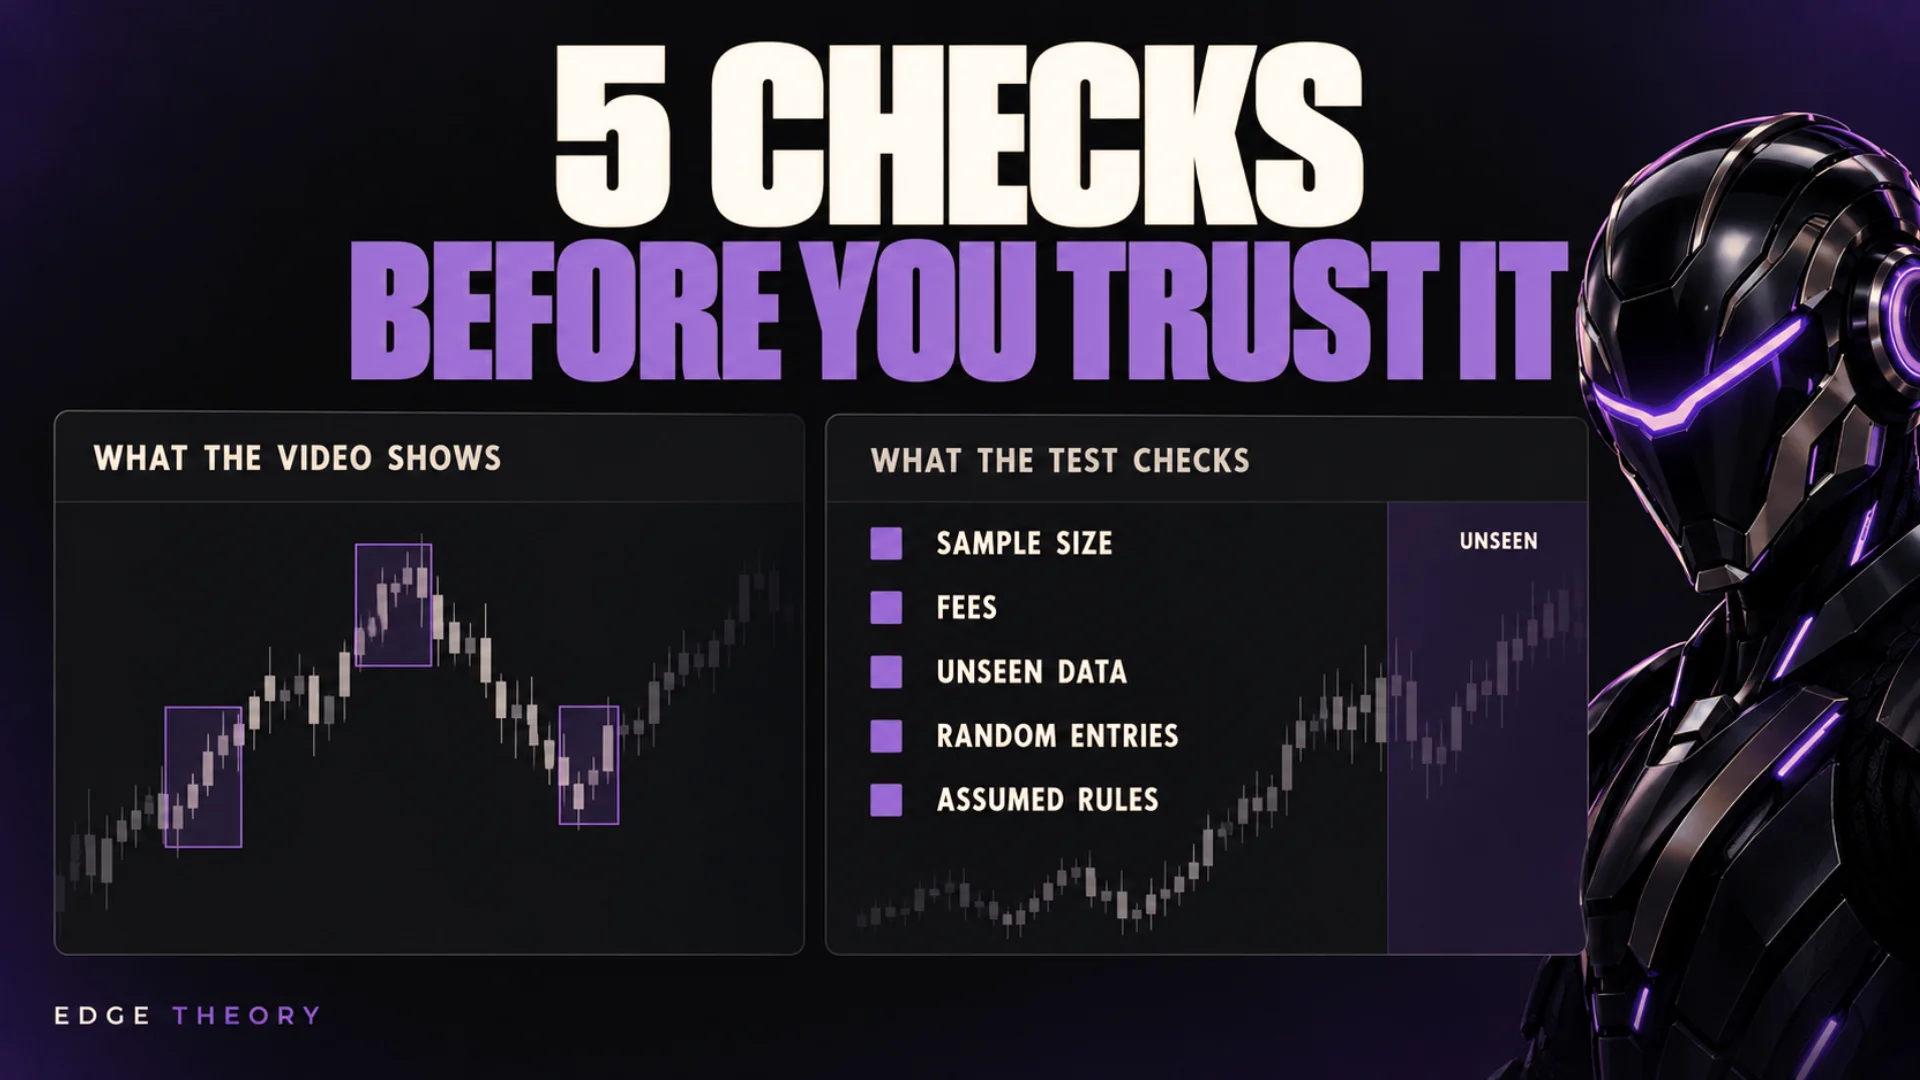
A strategy video has one job: to show you the setup working. The creator scrolls back, finds clean examples, marks entry, stop and target, and price obliges. That isn't dishonest; it's what a demonstration is. But it means the trades on screen were chosen after the creator already knew how they ended.
So the question isn't "did it work in the video?" It always works in the video. The question is whether the rules still hold when nobody gets to choose the examples. Here are five checks that answer it. Every one of them works on your own trade plan too.
Check 1: Is the sample big enough to mean anything?
A handful of winning trades feels convincing. The maths is less impressed.
Hypothetical example, not a real strategy: take a set of rules with a 1R stop and a 2R target that, over the long run, wins exactly one trade in three. Before costs, that's break-even: it has no edge at all. Now look at any 8 of its trades in a row. The chance of seeing 6 or more winners is about 2%, roughly 1 in 50. Rare, until you remember how many days of chart there are to scroll through. Look back far enough and a run like that turns up, and that's the run that gets shown.
The cure is simple: count the trades. A test with a few dozen trades is a first look. A few hundred, across different market conditions, starts to tell you something.
How to check it on Edge Theory: every Strategy Lab back test shows its historical range and number of completed trades. The Evidence Lab is stricter: with fewer than 30 completed trades it withholds the grade rather than "dressing uncertainty up as a score", and it reports out-of-sample trades against a 100-trade reference so thin samples are called out.
Check 2: What do fees do to it on short timeframes?
A lot of YouTube strategies run on the 1-minute to 15-minute charts. Fees are charged on the size of your position, not on the size of your stop, so the tighter the stop, the bigger the bite each fee takes out of every trade.
On Bybit's published fee page (last updated 2 September 2026), the base VIP 0 rate for perpetual and futures contracts is 0.055% taker and 0.02% maker. Bybit notes your actual rate can vary by region, so check your own fee page.
Illustrative arithmetic, not a back test result. Assume taker fees on both entry and exit, so a round trip costs 0.11% of the position. Assume the strategy risks 1R with a 2R target, and the stop is a set distance from entry:
Before fees: a 2R winner is +2R, a loser is −1R, and you break even winning 33.3% of trades.
4-hour swing trade, stop 3.0% from entry: fees cost about 0.04R a trade. A winner nets +1.96R, a loser −1.04R, and break-even rises to 34.6%.
5-minute scalp, stop 0.3% from entry: fees cost about 0.37R a trade. A winner nets +1.63R, a loser −1.37R, and break-even rises to 45.6%.
The same rules, the same 2R target, but on the 5-minute chart fees alone lift the break-even win rate from a third to nearly half. Over 100 trades, that's about 37R paid in fees before slippage or funding is counted. With maker fills at 0.02% each side the scalp's cost drops to about 0.13R a trade, but you can't assume every order fills as a maker. Slippage and funding payments come on top.
How to check it on Edge Theory: each Strategy Lab back test records the fees and slippage assumptions it used, so read them before you read the result. The Evidence Lab's fragility check then increases execution costs and varies nearby settings, to see whether the result only survives on the cheapest assumptions.
Check 3: Does it hold on candles the rules have never seen?
Every strategy is designed on a chart someone has already looked at. The creator picked the rules while watching the price history, and if you then tweak the stop or the timeframe until your back test looks better, you've done the same thing. The rules get fitted to that particular stretch of history, and that stretch is never coming back.
Researchers have put numbers on how quickly this happens. In Pseudo-Mathematics and Financial Charlatanism, published in the Notices of the American Mathematical Society in 2014, Bailey, Borwein, López de Prado and Zhu show that if none of the versions you try has any real skill, trying just seven independent configurations on a two-year back test is enough for the best one to be expected to show an in-sample Sharpe ratio of 1, while its expected out-of-sample Sharpe ratio is zero. Their conclusion is blunt:
"A back test which does not report the number of trials N used to identify the selected configuration makes it impossible to assess the risk of overfitting."
A YouTube video never tells you how many versions the creator tried before landing on this one. You can't control that, but you can control what happens next: test the rules on data that played no part in choosing them.
How to check it on Edge Theory: the Evidence Lab keeps the final 30% of the tested history hidden until you choose Reveal. The reveal is recorded for that strategy version and can't be undone, so you can't peek, adjust and peek again. Its overfitting meter also records your strategy trials and adjusts for repeated testing. The discipline that goes with it: fix your rules first, then reveal. If the back test and the unseen data tell different stories, believe the unseen data.
Check 4: Does it beat random entries?
Keep everything about the strategy the same: the market, the stop, the target, the costs, the trading hours. Change only one thing, when it enters, and randomise that hundreds of times. If your rules sit in the middle of the random results, the entry signal isn't adding anything. Whatever the back test showed came from the exits, the market's direction over that period or luck.
With a 1R stop and a 2R target, entries with no edge would be expected to win roughly a third of the time before costs. That's just the shape of the exits. So a win rate in the mid-30s on a 2R strategy, which can look respectable on screen, may simply be the exits doing their job.
How to check it on Edge Theory: the Evidence Lab's luck test compares the saved strategy with randomised entry timing, running 200 to 1,000 comparisons depending on your plan, and the report records the count it used. Beating random isn't proof of an edge. It's a reason to keep testing, not a reason to go live tomorrow.
Check 5: Which rules did the video leave open?
Most strategy videos and most personal trade plans share one weakness: they describe the setup clearly and leave the awkward details to judgement. A bot can't use judgement, so every gap has to be filled with a rule, and whoever fills it changes the strategy.
Take one real example. Data Trader's 4-hour range strategy starts by marking the high and low of the first 4-hour candle of the day in New York time. But crypto trades 24/7, and New York moves its clocks twice a year: it's UTC-4 in summer and UTC−5 in winter. So the midnight-to-4am New York block is 04:00 to 08:00 UTC in summer and 05:00 to 09:00 UTC in winter. If your data builds 4-hour candles from midnight UTC, that block matches a single candle for part of the year and straddles two for the rest. A bot needs one answer.
Other gaps turn up in almost every video and every trade plan:
The stop: "behind the key level" or "below the structure" puts the stop in a different place for every trader who reads it.
Day end: what happens to a trade that's still open when the session or day closes?
Repeats: one trade a day, or another entry after a stop-out?
Filters: "only trade with the trend". Which trend, on which timeframe, measured how?
Markets: the video showed one pair. Does the rule hold on another?
How to check it on Edge Theory: describe the strategy to Pulse in plain English, the way you'd explain it to a friend. Pulse can ask up to three short questions, then labels every rule it writes as from you, Assumed or Suggested. The from you rules came from what you typed. The Assumed rules are the gaps Pulse had to fill, and they're the most useful part of the read-back, because each one is a decision the video never made. Review and correct each assumption before you test, and if two answers are reasonable, test both as separate versions.
If you trade a strategy by hand, you're making these choices anyway. You just haven't written them down.
The five checks on one page
Sample: how many completed trades are behind the result, across how much history?
Fees: what are the round-trip costs as a share of the stop, and does the result survive higher costs?
Unseen data: were the rules fixed before they met the held-back candles, and do they still hold?
Random entries: does the entry beat the same strategy with its timing randomised?
Assumed rules: which rules did the video, or your plan, never actually state, and what did you choose?
None of the five guarantees anything. Pass all five and you still have a back test, which is the past, and perhaps a simulation, which is practice. But fail one and you've learned something before the market charged you for it.
Coming on Thursday: Creating Bots, Episode 1
We're starting a YouTube series that puts these checks to work on famous public strategies. It's called Creating Bots, and Episode 1 is out on Thursday 22 October, covering Data Trader's 4-hour range strategy, with full credit to him for publishing rules clear enough to test.
We'll describe the strategy to Pulse in plain English, show which rules came back as Assumed, write down how we filled each gap, then test it with fees, on unseen data and against random entries, and put the creator's own claim next to what we find. Results will be labelled as back test, unseen data or simulated, and we'll publish them whichever way they fall.
Run the checks on your own plan
The plan you already trade by hand is the best one to test, because you're the one relying on it.
Start free. The Free plan includes Pulse with 40 AI credits a month (a new design uses 4), Strategy Lab with no daily back test limit, and one simulated bot.
Describe your plan to Pulse and read every Assumed rule before you build it.
Back test it in Strategy Lab, check the trade count and the fee assumptions, then challenge it in the Evidence Lab.
Practise on a simulated paper bot. It runs against market data with no real funds, so you can see how the rules behave day to day.
Going live is a separate decision. From the Pro plan, live bots run on Bybit, Binance, OKX and Bitget, with Hyperliquid coming soon. Live trading involves risk and can lose money. If you're ready to upgrade, code SPOOKY20 gives 20% off any paid plan, first month or full year, until 31 October 2026 at 23:59 UK time.
Want one strategy taken through the evidence every week? Subscribe to The Edge Report, our Sunday email with a trade plan's rules and reasoning, Evidence Lab notes and the week ahead. New here? Start with our welcome post.
Back tested, simulated and live results are different things and are always labelled separately on this blog. Back tests and simulated results don't predict future performance. This article is educational and is not financial advice.